Friday, November 2, 2012

Survey Analysis

Only one person answered my survey and that was Professor Richter.  I think it was very nice that he has a pet and goes to church 4 times a month.  The Mean, Median, and Standard Deviation is very easy to explain. 
      It there is only one response and the answer is one, then 1 divided by 1 is 1; 1 is the mean.  The Median is 1 because when I wrote down the responses the number 1 was the middle number.  (When writting down all of the totals in order and choose the middle number, in my case my middle number is 1).  The Standard Formula example:
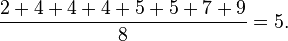
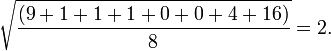
Consider a population consisting of the following eight values:

    2,\  4,\  4,\  4,\  5,\  5,\  7,\  9.
These eight data points have the mean (average) of 5:
    \frac{2 + 4 + 4 + 4 + 5 + 5 + 7 + 9}{8} = 5.
To calculate the population standard deviation, first compute the difference of each data point from the mean, and square the result of each:

    \begin{array}{lll}
    (2-5)^2 = (-3)^2 = 9  &&  (5-5)^2 = 0^2 = 0 \\
    (4-5)^2 = (-1)^2 = 1  &&  (5-5)^2 = 0^2 = 0 \\
    (4-5)^2 = (-1)^2 = 1  &&  (7-5)^2 = 2^2 = 4 \\
    (4-5)^2 = (-1)^2 = 1  &&  (9-5)^2 = 4^2 = 16. \\
    \end{array}
Next, compute the average of these values, and take the square root:

    \sqrt{ \frac{(9 + 1 + 1 + 1 + 0 + 0 + 4 + 16)}{8} } = 2.
   
My results for the standard deviation is 0.

No comments:

Post a Comment